Correlation Between Credit Spreads & Financial Metrics
November 2016
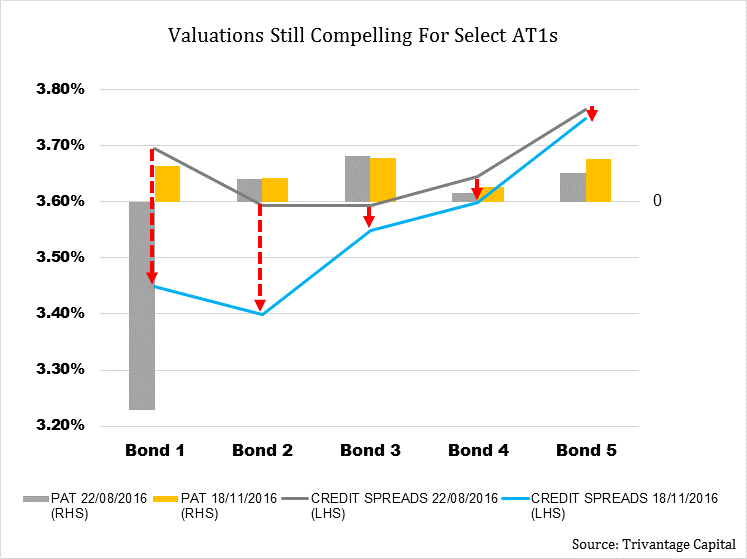
The chart below attempts to correlate the credit spreads of AT1 bonds over GOI bonds with the change in profitability of these banks between Q1 and Q2 FY 2017.
As can be seen, in case of a very distinct change in PAT in Bond 1, the credit spread has compressed distinctly.

In case of Bond 2, the credit spread has compressed without a significant change as the bank in question had a “one time event” of a large write-off which the management has confirmed has been fully provided for. The market therefore is assuming that the profitability from Q3 onwards will distinctly improve and this faith is reflected in the credit spread compression. Furthermore, Bond 2 is one with a split rating where one rating is above the AA psychological mark (the floor rating at which provident funds can invest) and the other one below. The market has started believing that the rating agency which has rated the bond below AA will consider upgrading the rating that can lead to a much sharper credit spread compression.
However, Bonds 3 to 5 have not been evaluated by the market with such detail and as the chart indicates, their credit spreads have not shown a significant change. We see this as a compelling opportunity for investors and something we are keeping in mind at the time of portfolio construction.
It is important to reiterate here that with the entry of sophisticated institutional investors in the rapidly growing AT1 category, it is crucial to pick the right banks that will see strengthening of both their credit and stock metrics. These are the banks that can confidently access the primary markets with AT1 issuances at lower yields and can over time access the equity markets to shore up their CET1 levels.
